Wednesday, March 30, 2022

Thursday, February 10, 2022

Even on the last day of the week, NEPSE declines double digit

 
nepse tech blog

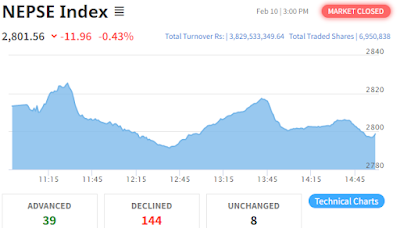
On Thursday, the NEPSE index fell by 11.96 points (fell 0.43% ) and reached to 2801.56. Of the 227 companies traded, 39 rose, 144 declined and eight remained unchanged.


Out of the 13 sub-groups traded, share prices of 3 sub-groups have risen and share prices of 10 sub-groups have declined.


Market capitalization has declined to Rs. 3 trillion and 95 billion.

Top Transactions


Technical Analysis

NEPSE Update: February 10, 2022

Technical Analysis Indicators

1. Bollinger Bands:


Analysis shows that the difference between the upper and lower band of Bollinger Bands has increased more than yesterday (today's difference: 245.04) which indicates that the volatility in the market has increased today. The market closed below the lower band (2635.77) today. Nepse closed below the lower band (2635.77) with the support area of ​​the lower band. Nepse seems to be closing below the lower band which shows that the market has not been able to determine any definite direction.

2. MACD:


Moving Average Convergence Divergence analysis shows that the MACD line is below the zero line. Histogram has decreased by 16.92 points. The MACD line has risen from the previous day's (13.54) points to 16.92. The signal line has also decreased. The MACD line and the signal line are seen to be in conversion and the cell signal is shown.

3. DMI:


The Directional Movement Indicator said that the +14 DMI line has decreased today as compared to yesterday and the -14 DMI line has increased. The +14 DAI and -14 DMI lines seem to cross each other and go into diversion which is not a good sign.

4. Candlestick: Nepse has made a dozy candlestick today which indicates uncertainty in the market.

5. Cumulative AD line:


NEPSE Update: February 10, 2022

The cumulative AD line has come down from yesterday-2114 to -2219. The total volume of Nepse stood at 6,081,777 which is 59 percent of the 21-day moving average volume (10,392,136.52).

Today, Nepse is held between the middle and lower bands, which seems to be unable to determine the direction of the market. The MACD line is above the zero line and the signal line is also above the zero line while the histogram is at 16.92. The MACD line can be seen below the signal line and the selling seems to have increased.

The -14 DMI line has increased while the +14 DMI line and ADX line have decreased. Which indicates an increase in selling momentum in the market. RSI today fell from 51.42 to 50.04 which indicates a slight decline in RSI momentum.

The nearest support to the next day of Nepse seems to be the area of ​​lower band 2760, the nearest obstruction of Nepse is the area of ​​2925 and 2967 (upper band). If the market corrects in a few days, it seems that the lower band can take support in the area.

Source: laltin.com


Wednesday, February 9, 2022

NEPSE Feb 9: Low turnover with a fall of 22 points


On Wednesday, Nepse fell by 22.11 points (fell 0.78%) to 2813.47. Of the 223 companies traded, 20 rose, 165 declined and 6 remained unchanged.


Of the thirteen subgroups traded, the share prices of all subgroups have declined.


Market capitalization has declined to Rs. 3 trillion and 97 billion.


Top transactions


Technical Analysis

NEPSE Update: February 9, 2022


Technical Analysis Indicators

1. Bollinger Bands:


Analysis shows that the difference between the upper and lower band of Bollinger Bands has decreased (today's difference: 206.77) which indicates that the volatility in the market has decreased today. The market today closed between the middle band (2863.88) and the lower band (2760.49).


2. Moving Average Convergence Divergence:

Moving Average Convergence Divergence analysis shows that the MACD line and the signal line are above the zero line. The histogram is at 15.13. The MACD line has come down from (43.66) points to (37.75) points. The signal line has decreased. The MACD line and the signal line appear to have diverted.

3. Directional Movement:


Directional movement indicator has increased by -14 DMI. The ADX line and the +14 DMI line have decreased. Which indicates an increase in selling momentum in the market.


4. Candlesticks: Today, Nepse has created the Bearish Maraboju Candlestick, which signifies Bearish market trend.


5. Cumulative AD line:


NEPSE Update: February 9, 2022


The cumulative AD line has come down from yesterday, 1969 to 2114. The total volume of Nepse stood at 5,663,334 which is 53 percent of the 21-day moving average volume (10,606,403.90).

Today, Nepse is held between the middle and lower bands, which seems to be unable to determine the direction of the market. The MACD line is above the zero line and the signal line is also above the zero line while the histogram is at 15.13. The MACD line can be seen below the signal line and the selling seems to have increased.

The -14 DMI line has increased while the +14 DMI line and ADX line have decreased which indicates an increase in selling momentum in the market. The RSI today fell to 51.42 from 53.97, indicating a slight decline in RSI momentum.

The nearest support to the next day of Nepse seems to be the area of ​​lower band 2760, the nearest obstruction of Nepse is the area of ​​2925 and 2967 (upper band). If the market corrects in a few days, it seems that the lower band can take support in the area.

Source: laltin.com

Tuesday, February 8, 2022

Even after the election announcement, investors are still reluctant in the stock market


On Tuesday, Nepse fell by 16.30 points (fell 0.58%) and reached to 2835.58. Out of 230 scrips traded, 40 companies have risen, 140 companies have declined and 11 companies have remained stable.


Out of the 13 sub-groups traded, share prices of 5 sub-groups have risen and share prices of 8 sub-groups have declined.


Market capitalization has declined to Rs. 4 trillion 07 billion.


Top transactions


Technical Analysis


Technical Analysis Indicators


1. Bollinger Bands:


Analysis shows that the difference between the upper and lower band of Bollinger Bands has decreased (today's difference: 203.59) which indicates that the volatility in the market has decreased today. The market is closing below the middle band (2864.80) today which shows that the market can test the lower band.


2. Moving Average Convergence Divergence:


Moving Average Convergence Divergence analysis shows that the MACD line and the signal line are above the zero line. The histogram is at 13.06 digits. The MACD line has come down from 48.57 points to 43.57 points. The signal line has decreased. Both the MACD line and the signal line seem to be moving downwards, which means that the market may see a correction or sideways move in a few days.


3. Directional Movement:


The Directional Movement Indicator shows an increase of +14 DMI line, a decrease of -14 DMI line and at the same time ADX line has increased by a small number. If both +14 DMI line and ADX line go upwards, then the market is understood to be positive.


4. Candlestick: 

Nepse has made a red body candlestick today which shows that the seller dominated the market today.


5. Cumulative AD Line: 


The cumulative AD line has been reduced from 1869 to 1969. The total volume of Nepse stood at 10,649,710 which is 97 percent of the 21 day moving average volume (10,928,416.62).

Nepse has closed below the middle band today. Which seems to have increased the selling pressure in the market. The MACD line is above the zero line and the signal line is also above the zero line while the histogram is at 13.00. According to MACD, there seems to be a selling momentum in the market.

The +14 DMI line has increased, the ADX line seems to have increased by a few points, while the резрек -14 DMI line has decreased. The RSI today fell from 55.87 to 53.97, indicating a slight decline in RSI momentum.

Nepse seems to have an area of ​​support 2820 near the next day and another support lower band is 2763. The area closest to Nepse seems to be the area of ​​2920.

Source: laltin.com

Monday, February 7, 2022

NEPSE Feb 7: Double digit increase but decline in transaction amount persists


On Monday, the NEPSE index rose by 15.69 points ( increased by 0.55%) to 2851.86. Of the 224 scrips traded, 105 rose, 70 declined and 15 remained unchanged.


Out of the 13 sub-groups traded, share prices of 10 sub-groups have risen and share prices of 3 sub-groups have declined.


The market capitalization has increased to Rs. 4 trillion 30 billion.

Top Transactions


Technical Analysis

NEPSE Update: February 7, 2022


Technical Analysis Indicators

1. Bollinger Bands:


The analysis shows that the difference between the upper and lower bands of the Bollinger Bands has decreased (today's difference: 213.9) which indicates that the volatility in the market has decreased today. The market closed below the middle band (2857.82) today, which indicates that the market could test the lower band.

2. Moving Average Convergence Divergence:


Moving Average Convergence Divergence analysis shows that the MACD line and the signal line are above the zero line. The histogram is at 11.70. The MACD line has come down from 51.89 points to 48.16 points. The signal line has decreased. Both the MACD line and the signal line seem to be moving downwards which means that the market may see a correction or sideways move in a few days.

3. Directional movement:


The Directional Movement Indicator has shown a decrease of +14 DMI line, while the -14 DMI line has also decreased by a small number and at the same time the ADX line has decreased by a small number. Which seems to be a correction in the market in a few days.

4. Candlestick:

Nepse has made a greenbody candlestick today which indicates uncertainty.

5. Cumulative AD Line:


The cumulative AD line has increased from 1904 to 1869. The total volume of Nepse stood at 8,548,647 which is 77 percent of the 21-day moving average volume (11,038,786.43).

Nepse has closed below the middle band today. The market seems to have broken the support area of ​​the middle band. The MACD line is above the zero line and the signal line is also above the zero line. The histogram is at 11.58. The MACD line appears to have crushed the signal line and gone down. If the MACD line crosses the signal line and goes upwards, it shows a positive signal and if it stays consolidated in the same area, Nepse may go sideways or down for a few days. +14 DMI line has decreased ADX line and ‍-14 DMI line has also decreased. RSI today rose from 54.42 to 55.85 which indicates a slight increase in RSI momentum. The closest support for the next day of Nepse seems to be the area of ​​2760. The closest obstruction of Nepse seems to be the area of ​​2862 (middle band) and the area of ​​2930.

Source: laltin.com

Are Aliens and UFOs Real or Are They Manufactured Fantasy ? -By Shreedhar Acharya

Are Aliens and UFOs Real or Are They Manufactured Fantasy ? -By Shreedhar Acharya : To date, nobody knows the starting and ending point of t...